You’re Alerting Wrong: The Why & How Of Setting An AWS Lambda Alarm Using Error Rate Percentages.

When it comes to operating Lambda, we often want to configure alarms to alert us when things aren’t running smoothly. Naturally our first choice for Lambda alarms is CloudWatch, the default monitoring service that comes with AWS.

Alarm CloudWatch

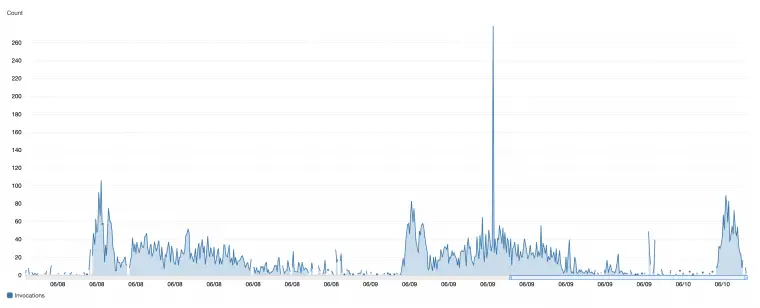
CloudWatch gives us some custom metrics out-of-the-box, such as: errors and invocation rates. But there are some problems we run into when setting up alarms based directly on these metrics.

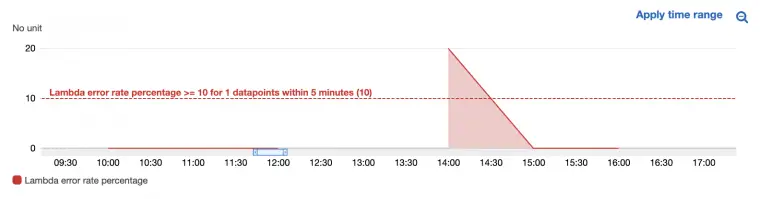
By the end of this article you’ll understand why alarms based on default AWS Lambda Metrics can cause difficulty, how AWS Metric Math helps us to apply “context” in our alarms and make them more effective, and how to setup an alarm using metric math to calculate an error rate percentage. 

How To Setup Monitoring / Observability On Existing Software (e.g. A Web API): A Practical 5 Step Guide.

Recently I find myself in the position of applying monitoring to existing software applications quite often. Whilst I have been applying the monitoring tools, I noticed that I follow the same steps each time…

Request Invocations

Which got me thinking: “Could you create a ‘recipe’ or ‘cookbook’ for how to apply monitoring to an existing software application?”. I set to work writing this article, and I can conclude, the answer is: yes!

By the end of this article you’ll know the 5 steps you should take when setting up monitoring on an existing service. 

You’re Logging Wrong: What One-Per-Service (“Phat Event”) Logs Are and Why You Need Them.

Common sense says that application logging is a good thing. But common advice doesn’t answer questions like: what to log, when to log, or the format to log, which can get really frustrating especially if you’re looking for precise guidance on to structure your logs. Today, we’re going to change that.

Log Lines To Phat Events

After years of struggling to find a canonical this-is-how-you-should-log advice I came across a concept of: one-per-service logs. But be warned: It’s a heretical idea that challenges common logging advice. But after my own experiments with the one-per-service logging, I’ve found it to have considerable benefits.

By the end of this article you will understand what a one-per-service Phat Event log is and why they can be superior to regular log entries.

How To Get AWS Lambda Logs Into CloudWatch

Part 1: Monitoring AWS Lambda

Your AWS Lambda code is throwing errors in production. To defuse the situation, you need to pinpoint what’s going wrong and find the fix. It’s a good thing you already instrumented your Lambda with high quality, well structured logs, right?

Dashboard CloudWatch

There are many aspects to monitoring a distributed system. And a big part is understanding how, and what to log. But, fear not, you’re in the right place!

Today we’re going to talk about the first step: how you can get Lambda logs into CloudWatch for analysis. Once we’ve discussed that, in the next article, we’ll discuss how to analyse those logs to properly extract the data.

By the end of this article you’ll understand the three steps you’ll need to take to enable CloudWatch logging for a Lambda function.